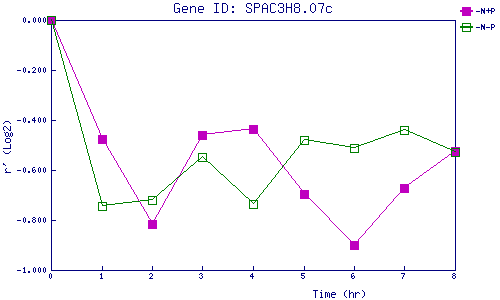
| 0 | 1 | 2 | 3 | 4 | 5 | 6 | 7 | 8 | |
| -N+P | 0.000 | -0.475 | -0.814 | -0.459 | -0.437 | -0.695 | -0.900 | -0.671 | -0.525 |
| -N-P | 0.000 | -0.744 | -0.719 | -0.549 | -0.734 | -0.482 | -0.511 | -0.442 | -0.530 |
|
-N+P: Nitrogen starved in the presence of P-factor -N-P: Nitrogen starved in the absence of P-factor |