spo20 sec14
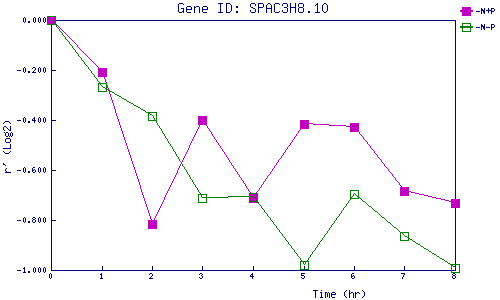
| 0 | 1 | 2 | 3 | 4 | 5 | 6 | 7 | 8 | |
| -N+P | 0.000 | -0.208 | -0.815 | -0.402 | -0.713 | -0.417 | -0.427 | -0.684 | -0.733 |
| -N-P | 0.000 | -0.267 | -0.382 | -0.711 | -0.709 | -0.981 | -0.696 | -0.865 | -0.993 |
|
-N+P: Nitrogen starved in the presence of P-factor -N-P: Nitrogen starved in the absence of P-factor |