| 0 | 1 | 2 | 3 | 4 | 5 | 6 | 7 | 8 | |
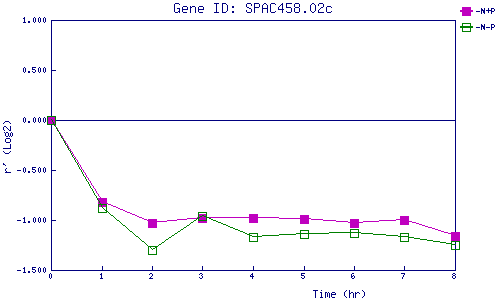
| -N+P | 0.000 | -0.816 | -1.032 | -0.984 | -0.984 | -0.988 | -1.031 | -1.001 | -1.155 |
| -N-P | 0.000 | -0.878 | -1.297 | -0.965 | -1.172 | -1.139 | -1.131 | -1.167 | -1.249 |
|
-N+P: Nitrogen starved in the presence of P-factor -N-P: Nitrogen starved in the absence of P-factor |