ptc4
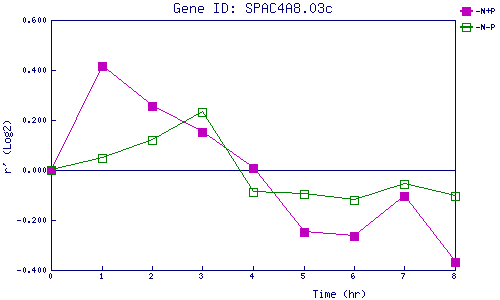
| 0 | 1 | 2 | 3 | 4 | 5 | 6 | 7 | 8 | |
| -N+P | 0.000 | 0.417 | 0.258 | 0.151 | 0.010 | -0.249 | -0.264 | -0.103 | -0.366 |
| -N-P | 0.000 | 0.049 | 0.120 | 0.231 | -0.088 | -0.096 | -0.119 | -0.055 | -0.105 |
|
-N+P: Nitrogen starved in the presence of P-factor -N-P: Nitrogen starved in the absence of P-factor |