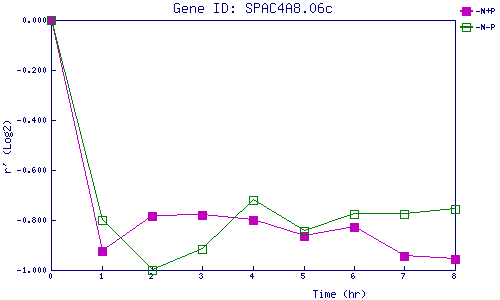
| 0 | 1 | 2 | 3 | 4 | 5 | 6 | 7 | 8 | |
| -N+P | 0.000 | -0.923 | -0.785 | -0.780 | -0.799 | -0.865 | -0.828 | -0.942 | -0.955 |
| -N-P | 0.000 | -0.798 | -0.999 | -0.917 | -0.720 | -0.844 | -0.776 | -0.774 | -0.757 |
|
-N+P: Nitrogen starved in the presence of P-factor -N-P: Nitrogen starved in the absence of P-factor |