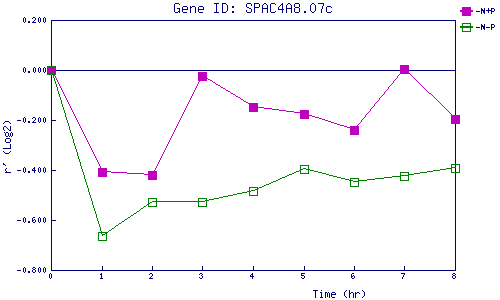
| 0 | 1 | 2 | 3 | 4 | 5 | 6 | 7 | 8 | |
| -N+P | 0.000 | -0.407 | -0.421 | -0.026 | -0.147 | -0.174 | -0.239 | 0.004 | -0.197 |
| -N-P | 0.000 | -0.663 | -0.526 | -0.526 | -0.483 | -0.396 | -0.448 | -0.425 | -0.392 |
|
-N+P: Nitrogen starved in the presence of P-factor -N-P: Nitrogen starved in the absence of P-factor |