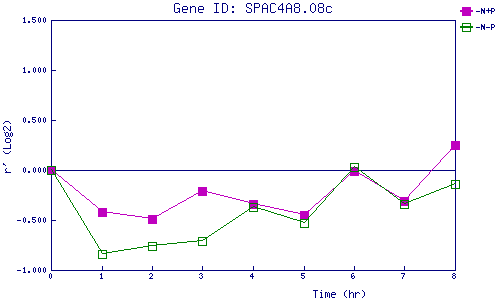
| 0 | 1 | 2 | 3 | 4 | 5 | 6 | 7 | 8 | |
| -N+P | 0.000 | -0.419 | -0.488 | -0.206 | -0.338 | -0.451 | -0.012 | -0.311 | 0.248 |
| -N-P | 0.000 | -0.839 | -0.761 | -0.708 | -0.370 | -0.527 | 0.032 | -0.345 | -0.142 |
|
-N+P: Nitrogen starved in the presence of P-factor -N-P: Nitrogen starved in the absence of P-factor |