cwf21
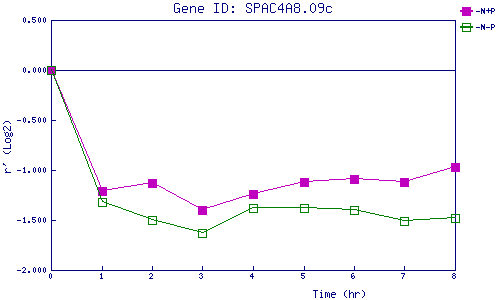
| 0 | 1 | 2 | 3 | 4 | 5 | 6 | 7 | 8 | |
| -N+P | 0.000 | -1.207 | -1.130 | -1.396 | -1.243 | -1.125 | -1.089 | -1.122 | -0.970 |
| -N-P | 0.000 | -1.323 | -1.495 | -1.627 | -1.377 | -1.383 | -1.403 | -1.512 | -1.478 |
|
-N+P: Nitrogen starved in the presence of P-factor -N-P: Nitrogen starved in the absence of P-factor |