sds22
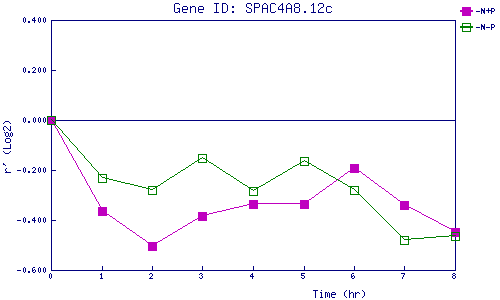
| 0 | 1 | 2 | 3 | 4 | 5 | 6 | 7 | 8 | |
| -N+P | 0.000 | -0.365 | -0.504 | -0.384 | -0.336 | -0.337 | -0.191 | -0.339 | -0.446 |
| -N-P | 0.000 | -0.231 | -0.279 | -0.151 | -0.285 | -0.163 | -0.278 | -0.482 | -0.466 |
|
-N+P: Nitrogen starved in the presence of P-factor -N-P: Nitrogen starved in the absence of P-factor |