prs1
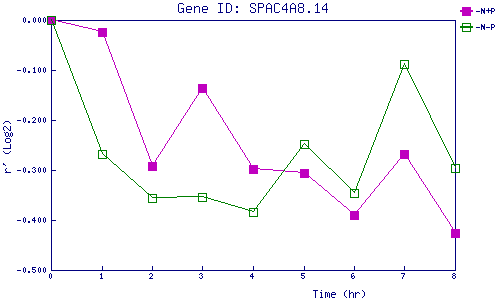
| 0 | 1 | 2 | 3 | 4 | 5 | 6 | 7 | 8 | |
| -N+P | 0.000 | -0.025 | -0.292 | -0.135 | -0.298 | -0.306 | -0.390 | -0.268 | -0.426 |
| -N-P | 0.000 | -0.269 | -0.357 | -0.354 | -0.383 | -0.249 | -0.346 | -0.087 | -0.297 |
|
-N+P: Nitrogen starved in the presence of P-factor -N-P: Nitrogen starved in the absence of P-factor |