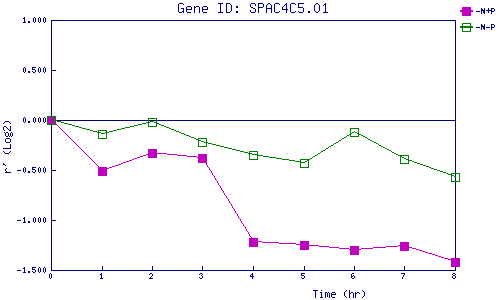
| 0 | 1 | 2 | 3 | 4 | 5 | 6 | 7 | 8 | |
| -N+P | 0.000 | -0.513 | -0.332 | -0.377 | -1.225 | -1.246 | -1.299 | -1.260 | -1.415 |
| -N-P | 0.000 | -0.144 | -0.017 | -0.217 | -0.353 | -0.426 | -0.121 | -0.392 | -0.573 |
|
-N+P: Nitrogen starved in the presence of P-factor -N-P: Nitrogen starved in the absence of P-factor |