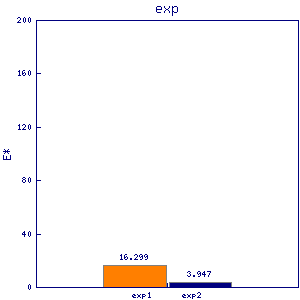
rad31 uba4
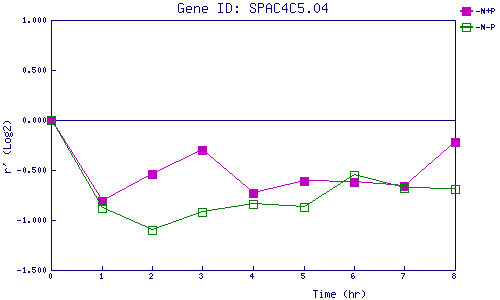
| 0 | 1 | 2 | 3 | 4 | 5 | 6 | 7 | 8 | |
| -N+P | 0.000 | -0.809 | -0.540 | -0.305 | -0.734 | -0.613 | -0.625 | -0.656 | -0.215 |
| -N-P | 0.000 | -0.883 | -1.103 | -0.916 | -0.845 | -0.867 | -0.549 | -0.675 | -0.692 |
|
-N+P: Nitrogen starved in the presence of P-factor -N-P: Nitrogen starved in the absence of P-factor |