| 0 | 1 | 2 | 3 | 4 | 5 | 6 | 7 | 8 | |
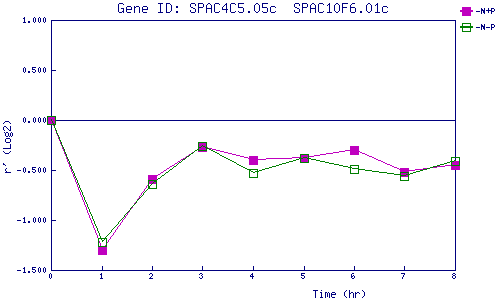
| -N+P | 0.000 | -1.295 | -0.589 | -0.274 | -0.396 | -0.381 | -0.296 | -0.519 | -0.452 |
| -N-P | 0.000 | -1.215 | -0.641 | -0.260 | -0.531 | -0.382 | -0.493 | -0.562 | -0.414 |
|
-N+P: Nitrogen starved in the presence of P-factor -N-P: Nitrogen starved in the absence of P-factor |