sud1 pop2
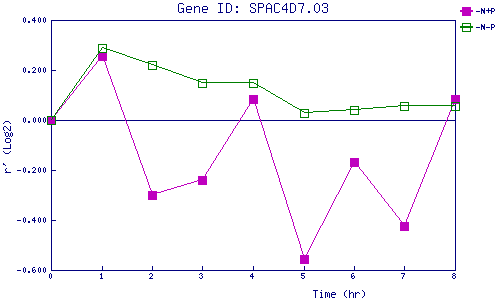
| 0 | 1 | 2 | 3 | 4 | 5 | 6 | 7 | 8 | |
| -N+P | 0.000 | 0.254 | -0.299 | -0.239 | 0.084 | -0.556 | -0.168 | -0.426 | 0.085 |
| -N-P | 0.000 | 0.287 | 0.219 | 0.149 | 0.148 | 0.028 | 0.039 | 0.055 | 0.055 |
|
-N+P: Nitrogen starved in the presence of P-factor -N-P: Nitrogen starved in the absence of P-factor |