| 0 | 1 | 2 | 3 | 4 | 5 | 6 | 7 | 8 | |
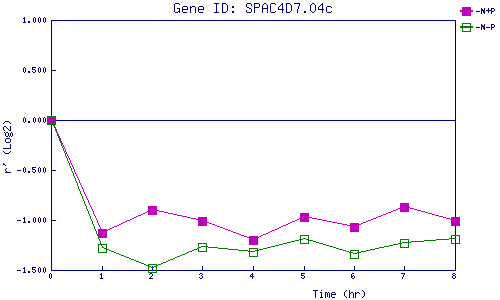
| -N+P | 0.000 | -1.131 | -0.904 | -1.007 | -1.202 | -0.971 | -1.066 | -0.872 | -1.006 |
| -N-P | 0.000 | -1.284 | -1.480 | -1.270 | -1.324 | -1.186 | -1.335 | -1.230 | -1.189 |
|
-N+P: Nitrogen starved in the presence of P-factor -N-P: Nitrogen starved in the absence of P-factor |