tif34 sum1
| 0 | 1 | 2 | 3 | 4 | 5 | 6 | 7 | 8 | |
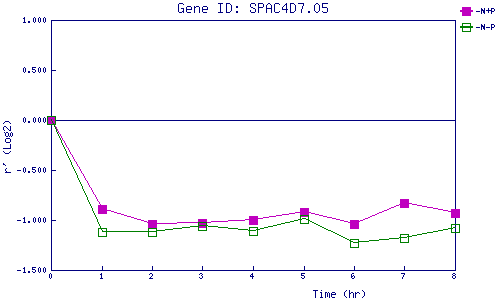
| -N+P | 0.000 | -0.893 | -1.041 | -1.026 | -1.004 | -0.920 | -1.040 | -0.827 | -0.930 |
| -N-P | 0.000 | -1.116 | -1.124 | -1.055 | -1.108 | -0.987 | -1.229 | -1.179 | -1.085 |
|
-N+P: Nitrogen starved in the presence of P-factor -N-P: Nitrogen starved in the absence of P-factor |