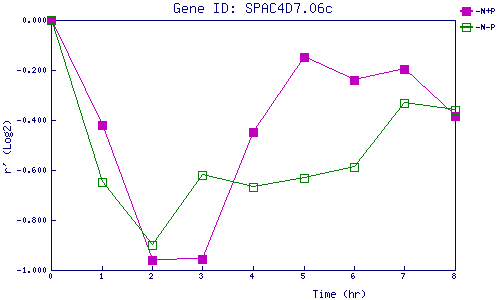
| 0 | 1 | 2 | 3 | 4 | 5 | 6 | 7 | 8 | |
| -N+P | 0.000 | -0.420 | -0.960 | -0.955 | -0.447 | -0.149 | -0.242 | -0.197 | -0.382 |
| -N-P | 0.000 | -0.649 | -0.899 | -0.620 | -0.668 | -0.630 | -0.587 | -0.332 | -0.362 |
|
-N+P: Nitrogen starved in the presence of P-factor -N-P: Nitrogen starved in the absence of P-factor |