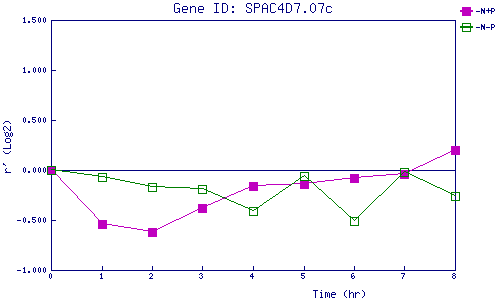
| 0 | 1 | 2 | 3 | 4 | 5 | 6 | 7 | 8 | |
| -N+P | 0.000 | -0.535 | -0.616 | -0.381 | -0.159 | -0.137 | -0.077 | -0.043 | 0.205 |
| -N-P | 0.000 | -0.071 | -0.167 | -0.187 | -0.412 | -0.063 | -0.507 | -0.015 | -0.263 |
|
-N+P: Nitrogen starved in the presence of P-factor -N-P: Nitrogen starved in the absence of P-factor |