ade4 min13 aza1 Sp-snR58-sno
| 0 | 1 | 2 | 3 | 4 | 5 | 6 | 7 | 8 | |
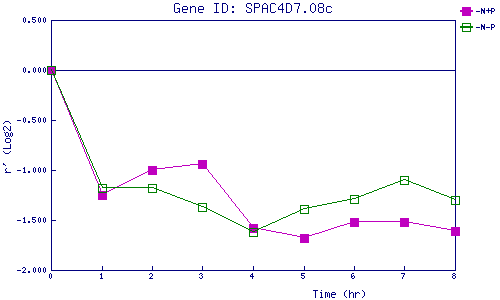
| -N+P | 0.000 | -1.252 | -0.999 | -0.938 | -1.578 | -1.678 | -1.525 | -1.515 | -1.607 |
| -N-P | 0.000 | -1.179 | -1.180 | -1.371 | -1.624 | -1.388 | -1.290 | -1.102 | -1.305 |
|
-N+P: Nitrogen starved in the presence of P-factor -N-P: Nitrogen starved in the absence of P-factor |