tif223
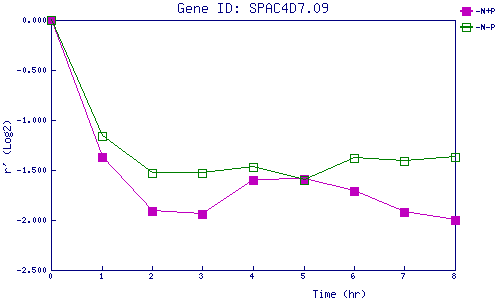
| 0 | 1 | 2 | 3 | 4 | 5 | 6 | 7 | 8 | |
| -N+P | 0.000 | -1.373 | -1.907 | -1.942 | -1.604 | -1.588 | -1.709 | -1.921 | -2.002 |
| -N-P | 0.000 | -1.164 | -1.526 | -1.528 | -1.474 | -1.598 | -1.383 | -1.406 | -1.369 |
|
-N+P: Nitrogen starved in the presence of P-factor -N-P: Nitrogen starved in the absence of P-factor |