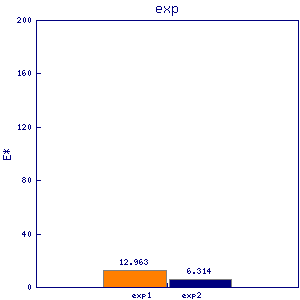
fet5
| 0 | 1 | 2 | 3 | 4 | 5 | 6 | 7 | 8 | |
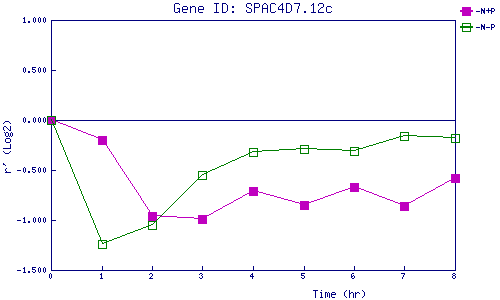
| -N+P | 0.000 | -0.195 | -0.958 | -0.993 | -0.707 | -0.848 | -0.668 | -0.865 | -0.580 |
| -N-P | 0.000 | -1.237 | -1.051 | -0.546 | -0.322 | -0.290 | -0.308 | -0.158 | -0.178 |
|
-N+P: Nitrogen starved in the presence of P-factor -N-P: Nitrogen starved in the absence of P-factor |