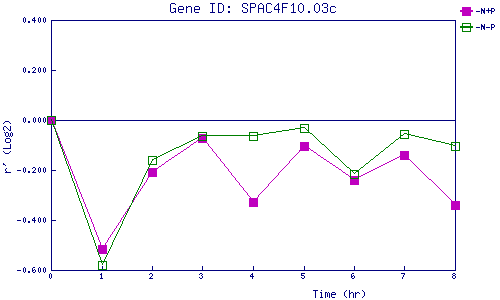
| 0 | 1 | 2 | 3 | 4 | 5 | 6 | 7 | 8 | |
| -N+P | 0.000 | -0.515 | -0.209 | -0.074 | -0.330 | -0.104 | -0.240 | -0.139 | -0.339 |
| -N-P | 0.000 | -0.580 | -0.162 | -0.064 | -0.064 | -0.033 | -0.218 | -0.055 | -0.105 |
|
-N+P: Nitrogen starved in the presence of P-factor -N-P: Nitrogen starved in the absence of P-factor |