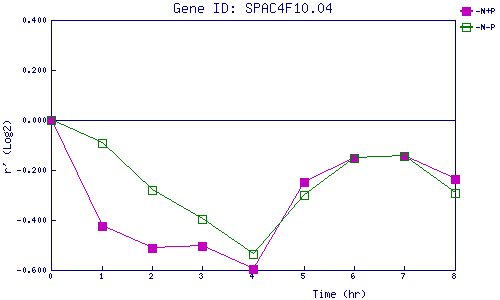
| 0 | 1 | 2 | 3 | 4 | 5 | 6 | 7 | 8 | |
| -N+P | 0.000 | -0.425 | -0.514 | -0.502 | -0.596 | -0.249 | -0.152 | -0.144 | -0.236 |
| -N-P | 0.000 | -0.091 | -0.280 | -0.396 | -0.538 | -0.299 | -0.152 | -0.144 | -0.293 |
|
-N+P: Nitrogen starved in the presence of P-factor -N-P: Nitrogen starved in the absence of P-factor |