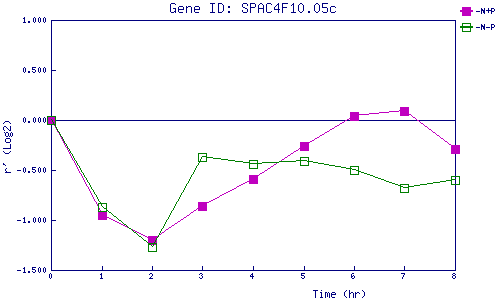
| 0 | 1 | 2 | 3 | 4 | 5 | 6 | 7 | 8 | |
| -N+P | 0.000 | -0.954 | -1.201 | -0.864 | -0.594 | -0.265 | 0.037 | 0.088 | -0.293 |
| -N-P | 0.000 | -0.873 | -1.271 | -0.370 | -0.439 | -0.409 | -0.504 | -0.677 | -0.598 |
|
-N+P: Nitrogen starved in the presence of P-factor -N-P: Nitrogen starved in the absence of P-factor |