| 0 | 1 | 2 | 3 | 4 | 5 | 6 | 7 | 8 | |
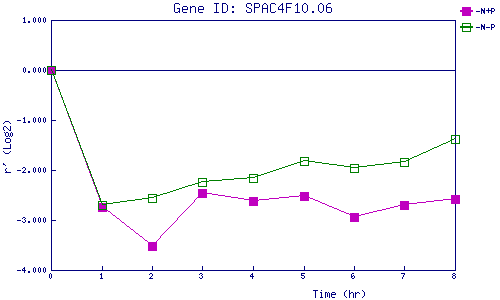
| -N+P | 0.000 | -2.745 | -3.511 | -2.468 | -2.618 | -2.523 | -2.940 | -2.702 | -2.581 |
| -N-P | 0.000 | -2.692 | -2.560 | -2.237 | -2.159 | -1.823 | -1.959 | -1.832 | -1.384 |
|
-N+P: Nitrogen starved in the presence of P-factor -N-P: Nitrogen starved in the absence of P-factor |