| 0 | 1 | 2 | 3 | 4 | 5 | 6 | 7 | 8 | |
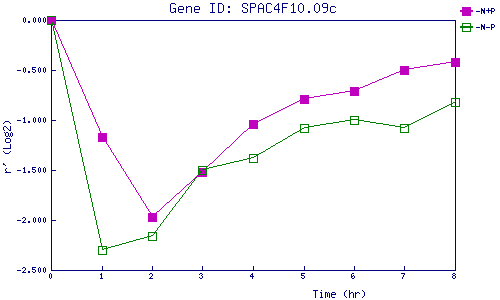
| -N+P | 0.000 | -1.168 | -1.973 | -1.517 | -1.041 | -0.789 | -0.713 | -0.497 | -0.418 |
| -N-P | 0.000 | -2.298 | -2.155 | -1.501 | -1.381 | -1.083 | -0.996 | -1.075 | -0.820 |
|
-N+P: Nitrogen starved in the presence of P-factor -N-P: Nitrogen starved in the absence of P-factor |