| 0 | 1 | 2 | 3 | 4 | 5 | 6 | 7 | 8 | |
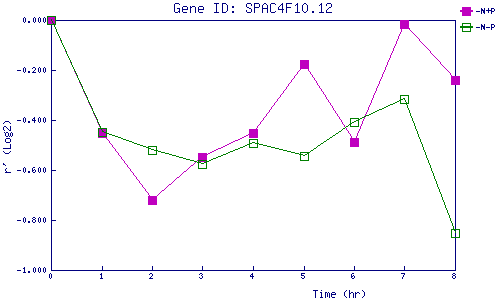
| -N+P | 0.000 | -0.452 | -0.718 | -0.547 | -0.452 | -0.178 | -0.486 | -0.014 | -0.238 |
| -N-P | 0.000 | -0.450 | -0.519 | -0.578 | -0.493 | -0.542 | -0.406 | -0.315 | -0.853 |
|
-N+P: Nitrogen starved in the presence of P-factor -N-P: Nitrogen starved in the absence of P-factor |