| 0 | 1 | 2 | 3 | 4 | 5 | 6 | 7 | 8 | |
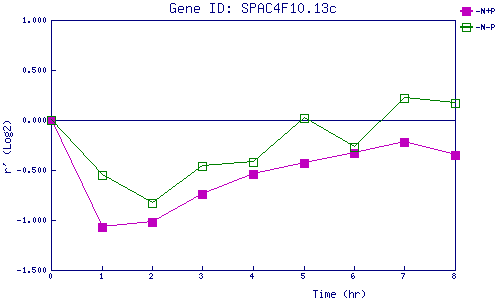
| -N+P | 0.000 | -1.067 | -1.016 | -0.736 | -0.536 | -0.426 | -0.326 | -0.224 | -0.352 |
| -N-P | 0.000 | -0.550 | -0.831 | -0.463 | -0.422 | 0.016 | -0.267 | 0.224 | 0.169 |
|
-N+P: Nitrogen starved in the presence of P-factor -N-P: Nitrogen starved in the absence of P-factor |