btf3
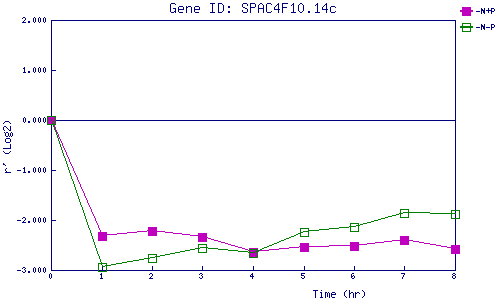
| 0 | 1 | 2 | 3 | 4 | 5 | 6 | 7 | 8 | |
| -N+P | 0.000 | -2.310 | -2.228 | -2.346 | -2.638 | -2.545 | -2.516 | -2.407 | -2.575 |
| -N-P | 0.000 | -2.935 | -2.761 | -2.571 | -2.660 | -2.230 | -2.132 | -1.854 | -1.890 |
|
-N+P: Nitrogen starved in the presence of P-factor -N-P: Nitrogen starved in the absence of P-factor |