| 0 | 1 | 2 | 3 | 4 | 5 | 6 | 7 | 8 | |
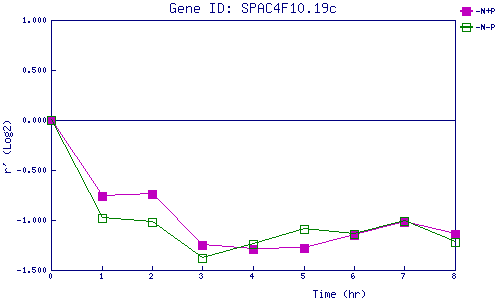
| -N+P | 0.000 | -0.762 | -0.737 | -1.254 | -1.289 | -1.279 | -1.148 | -1.020 | -1.141 |
| -N-P | 0.000 | -0.977 | -1.023 | -1.379 | -1.240 | -1.094 | -1.142 | -1.013 | -1.218 |
|
-N+P: Nitrogen starved in the presence of P-factor -N-P: Nitrogen starved in the absence of P-factor |