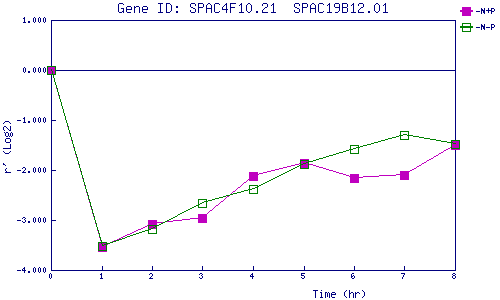
| 0 | 1 | 2 | 3 | 4 | 5 | 6 | 7 | 8 | |
| -N+P | 0.000 | -3.538 | -3.080 | -2.966 | -2.130 | -1.869 | -2.155 | -2.094 | -1.499 |
| -N-P | 0.000 | -3.515 | -3.181 | -2.652 | -2.384 | -1.889 | -1.589 | -1.291 | -1.472 |
|
-N+P: Nitrogen starved in the presence of P-factor -N-P: Nitrogen starved in the absence of P-factor |