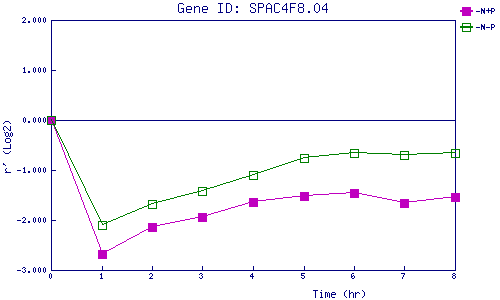
| 0 | 1 | 2 | 3 | 4 | 5 | 6 | 7 | 8 | |
| -N+P | 0.000 | -2.686 | -2.148 | -1.935 | -1.638 | -1.527 | -1.456 | -1.664 | -1.545 |
| -N-P | 0.000 | -2.105 | -1.670 | -1.420 | -1.092 | -0.753 | -0.658 | -0.699 | -0.662 |
|
-N+P: Nitrogen starved in the presence of P-factor -N-P: Nitrogen starved in the absence of P-factor |