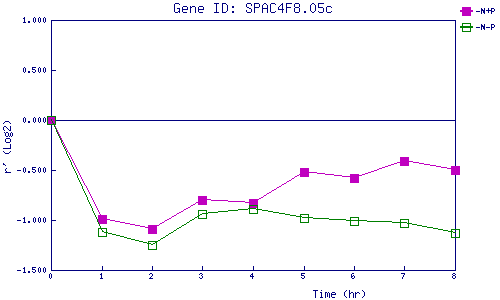
| 0 | 1 | 2 | 3 | 4 | 5 | 6 | 7 | 8 | |
| -N+P | 0.000 | -0.994 | -1.086 | -0.795 | -0.828 | -0.518 | -0.575 | -0.412 | -0.495 |
| -N-P | 0.000 | -1.115 | -1.248 | -0.945 | -0.894 | -0.982 | -1.006 | -1.033 | -1.126 |
|
-N+P: Nitrogen starved in the presence of P-factor -N-P: Nitrogen starved in the absence of P-factor |