hxk2
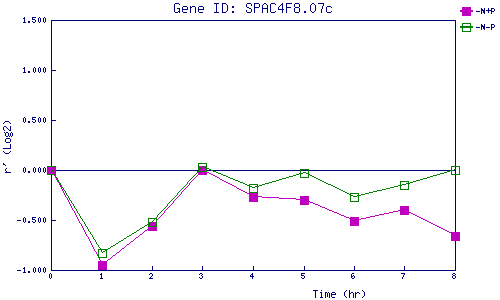
| 0 | 1 | 2 | 3 | 4 | 5 | 6 | 7 | 8 | |
| -N+P | 0.000 | -0.952 | -0.561 | -0.002 | -0.266 | -0.297 | -0.512 | -0.404 | -0.665 |
| -N-P | 0.000 | -0.831 | -0.518 | 0.031 | -0.175 | -0.034 | -0.274 | -0.150 | 0.005 |
|
-N+P: Nitrogen starved in the presence of P-factor -N-P: Nitrogen starved in the absence of P-factor |