| 0 | 1 | 2 | 3 | 4 | 5 | 6 | 7 | 8 | |
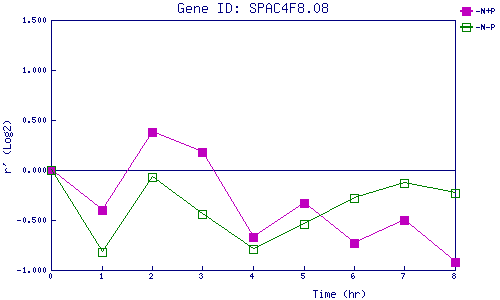
| -N+P | 0.000 | -0.399 | 0.384 | 0.184 | -0.669 | -0.331 | -0.732 | -0.501 | -0.915 |
| -N-P | 0.000 | -0.823 | -0.070 | -0.439 | -0.788 | -0.538 | -0.275 | -0.134 | -0.230 |
|
-N+P: Nitrogen starved in the presence of P-factor -N-P: Nitrogen starved in the absence of P-factor |