hcs hcs1
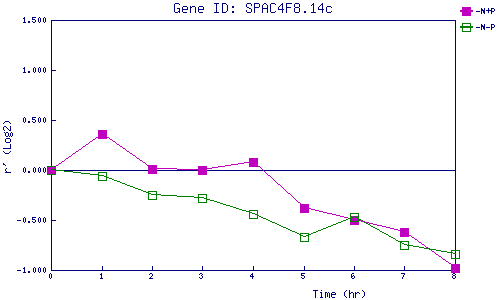
| 0 | 1 | 2 | 3 | 4 | 5 | 6 | 7 | 8 | |
| -N+P | 0.000 | 0.355 | 0.006 | 0.002 | 0.078 | -0.376 | -0.500 | -0.616 | -0.980 |
| -N-P | 0.000 | -0.055 | -0.250 | -0.280 | -0.444 | -0.666 | -0.472 | -0.749 | -0.836 |
|
-N+P: Nitrogen starved in the presence of P-factor -N-P: Nitrogen starved in the absence of P-factor |