| 0 | 1 | 2 | 3 | 4 | 5 | 6 | 7 | 8 | |
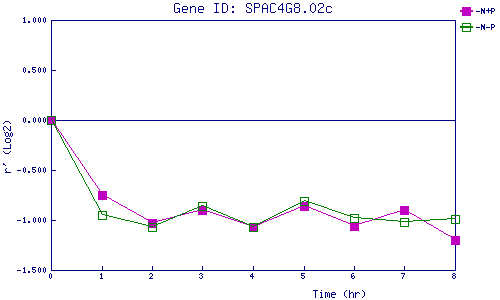
| -N+P | 0.000 | -0.749 | -1.033 | -0.897 | -1.070 | -0.862 | -1.056 | -0.903 | -1.204 |
| -N-P | 0.000 | -0.953 | -1.071 | -0.859 | -1.071 | -0.813 | -0.985 | -1.022 | -0.990 |
|
-N+P: Nitrogen starved in the presence of P-factor -N-P: Nitrogen starved in the absence of P-factor |