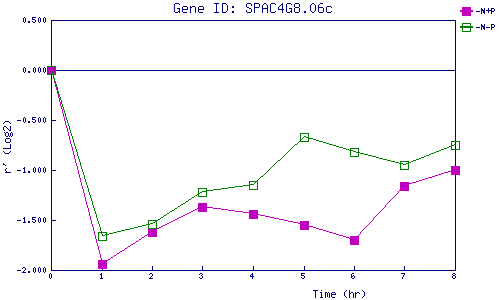
| 0 | 1 | 2 | 3 | 4 | 5 | 6 | 7 | 8 | |
| -N+P | 0.000 | -1.945 | -1.619 | -1.366 | -1.444 | -1.550 | -1.705 | -1.156 | -0.996 |
| -N-P | 0.000 | -1.664 | -1.538 | -1.217 | -1.153 | -0.666 | -0.819 | -0.947 | -0.754 |
|
-N+P: Nitrogen starved in the presence of P-factor -N-P: Nitrogen starved in the absence of P-factor |