| 0 | 1 | 2 | 3 | 4 | 5 | 6 | 7 | 8 | |
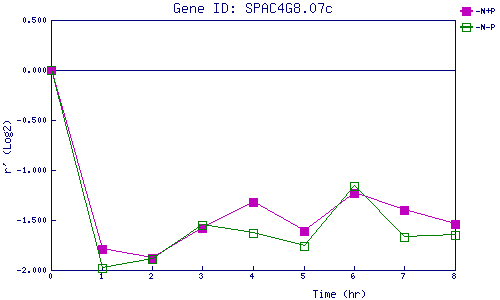
| -N+P | 0.000 | -1.787 | -1.877 | -1.584 | -1.321 | -1.610 | -1.234 | -1.402 | -1.541 |
| -N-P | 0.000 | -1.976 | -1.888 | -1.553 | -1.627 | -1.757 | -1.163 | -1.674 | -1.653 |
|
-N+P: Nitrogen starved in the presence of P-factor -N-P: Nitrogen starved in the absence of P-factor |