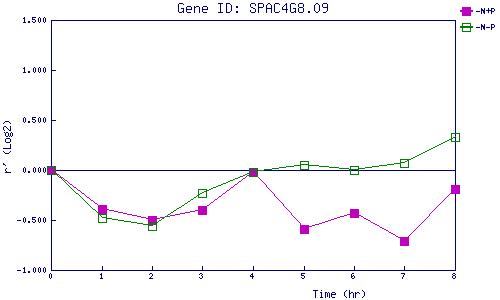
| 0 | 1 | 2 | 3 | 4 | 5 | 6 | 7 | 8 | |
| -N+P | 0.000 | -0.392 | -0.502 | -0.396 | -0.024 | -0.588 | -0.434 | -0.707 | -0.193 |
| -N-P | 0.000 | -0.481 | -0.563 | -0.234 | -0.020 | 0.050 | -0.001 | 0.070 | 0.333 |
|
-N+P: Nitrogen starved in the presence of P-factor -N-P: Nitrogen starved in the absence of P-factor |