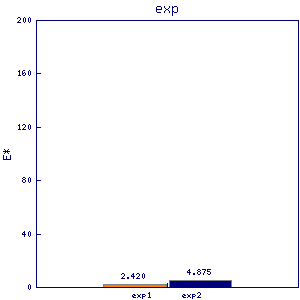
atp10
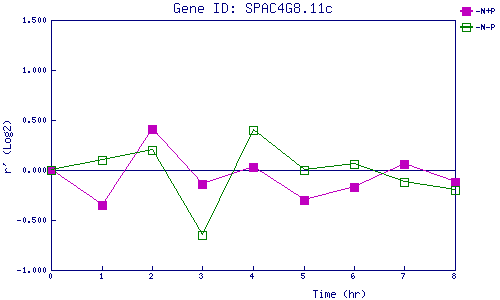
| 0 | 1 | 2 | 3 | 4 | 5 | 6 | 7 | 8 | |
| -N+P | 0.000 | -0.354 | 0.413 | -0.145 | 0.028 | -0.297 | -0.168 | 0.064 | -0.115 |
| -N-P | 0.000 | 0.105 | 0.203 | -0.654 | 0.397 | 0.002 | 0.064 | -0.122 | -0.200 |
|
-N+P: Nitrogen starved in the presence of P-factor -N-P: Nitrogen starved in the absence of P-factor |