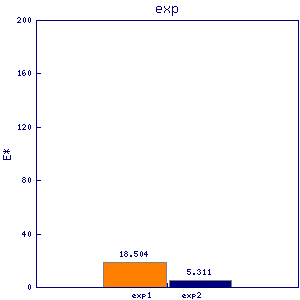
alp11
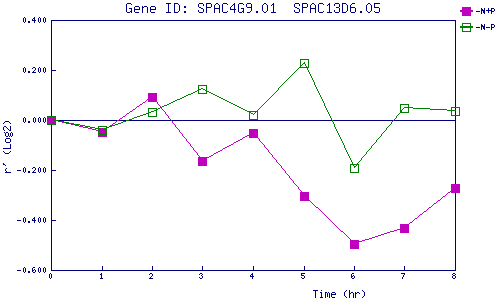
| 0 | 1 | 2 | 3 | 4 | 5 | 6 | 7 | 8 | |
| -N+P | 0.000 | -0.050 | 0.092 | -0.164 | -0.051 | -0.304 | -0.497 | -0.432 | -0.274 |
| -N-P | 0.000 | -0.038 | 0.031 | 0.125 | 0.020 | 0.229 | -0.191 | 0.048 | 0.035 |
|
-N+P: Nitrogen starved in the presence of P-factor -N-P: Nitrogen starved in the absence of P-factor |