| 0 | 1 | 2 | 3 | 4 | 5 | 6 | 7 | 8 | |
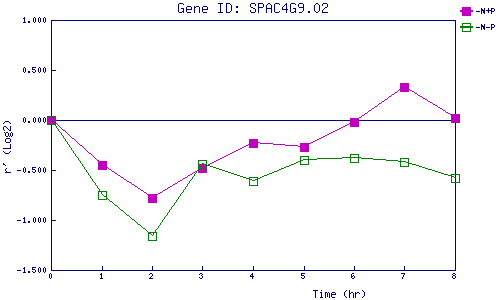
| -N+P | 0.000 | -0.450 | -0.778 | -0.481 | -0.233 | -0.269 | -0.023 | 0.328 | 0.019 |
| -N-P | 0.000 | -0.752 | -1.161 | -0.438 | -0.607 | -0.397 | -0.385 | -0.422 | -0.576 |
|
-N+P: Nitrogen starved in the presence of P-factor -N-P: Nitrogen starved in the absence of P-factor |