adk1
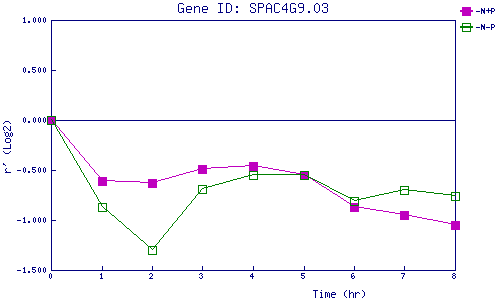
| 0 | 1 | 2 | 3 | 4 | 5 | 6 | 7 | 8 | |
| -N+P | 0.000 | -0.610 | -0.632 | -0.491 | -0.463 | -0.550 | -0.874 | -0.952 | -1.052 |
| -N-P | 0.000 | -0.868 | -1.299 | -0.690 | -0.552 | -0.550 | -0.809 | -0.705 | -0.758 |
|
-N+P: Nitrogen starved in the presence of P-factor -N-P: Nitrogen starved in the absence of P-factor |