| 0 | 1 | 2 | 3 | 4 | 5 | 6 | 7 | 8 | |
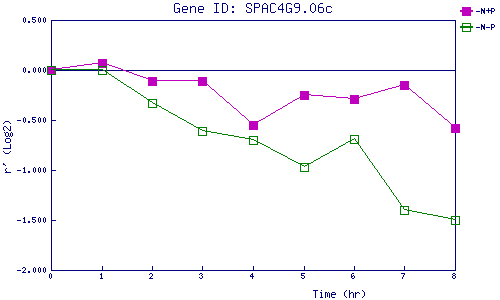
| -N+P | 0.000 | 0.067 | -0.108 | -0.113 | -0.547 | -0.248 | -0.291 | -0.149 | -0.579 |
| -N-P | 0.000 | 0.000 | -0.328 | -0.608 | -0.695 | -0.967 | -0.694 | -1.403 | -1.504 |
|
-N+P: Nitrogen starved in the presence of P-factor -N-P: Nitrogen starved in the absence of P-factor |