rpc2
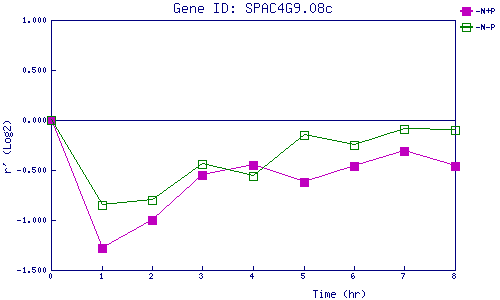
| 0 | 1 | 2 | 3 | 4 | 5 | 6 | 7 | 8 | |
| -N+P | 0.000 | -1.276 | -0.997 | -0.547 | -0.453 | -0.625 | -0.462 | -0.307 | -0.465 |
| -N-P | 0.000 | -0.847 | -0.795 | -0.440 | -0.565 | -0.151 | -0.251 | -0.089 | -0.098 |
|
-N+P: Nitrogen starved in the presence of P-factor -N-P: Nitrogen starved in the absence of P-factor |