arg3
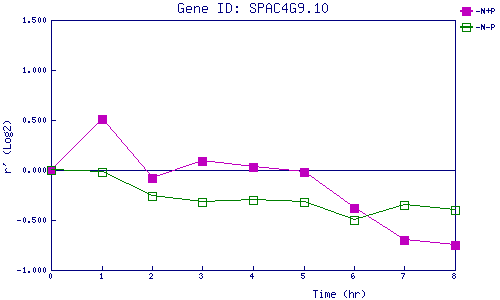
| 0 | 1 | 2 | 3 | 4 | 5 | 6 | 7 | 8 | |
| -N+P | 0.000 | 0.507 | -0.084 | 0.090 | 0.033 | -0.023 | -0.385 | -0.702 | -0.752 |
| -N-P | 0.000 | -0.020 | -0.259 | -0.324 | -0.296 | -0.322 | -0.504 | -0.352 | -0.405 |
|
-N+P: Nitrogen starved in the presence of P-factor -N-P: Nitrogen starved in the absence of P-factor |