rpl901 rpl9-1
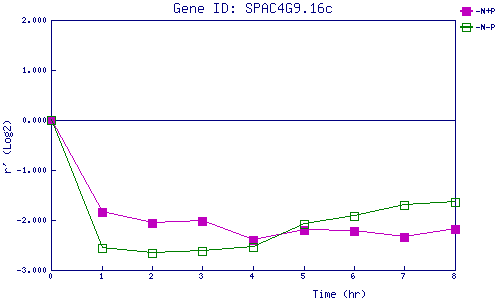
| 0 | 1 | 2 | 3 | 4 | 5 | 6 | 7 | 8 | |
| -N+P | 0.000 | -1.840 | -2.057 | -2.014 | -2.400 | -2.195 | -2.220 | -2.333 | -2.180 |
| -N-P | 0.000 | -2.568 | -2.654 | -2.619 | -2.531 | -2.087 | -1.923 | -1.692 | -1.645 |
|
-N+P: Nitrogen starved in the presence of P-factor -N-P: Nitrogen starved in the absence of P-factor |