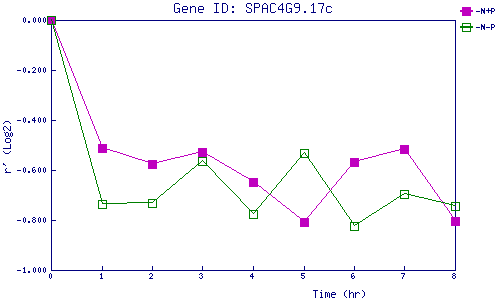
| 0 | 1 | 2 | 3 | 4 | 5 | 6 | 7 | 8 | |
| -N+P | 0.000 | -0.510 | -0.575 | -0.528 | -0.647 | -0.807 | -0.570 | -0.516 | -0.804 |
| -N-P | 0.000 | -0.738 | -0.731 | -0.565 | -0.777 | -0.532 | -0.823 | -0.698 | -0.742 |
|
-N+P: Nitrogen starved in the presence of P-factor -N-P: Nitrogen starved in the absence of P-factor |