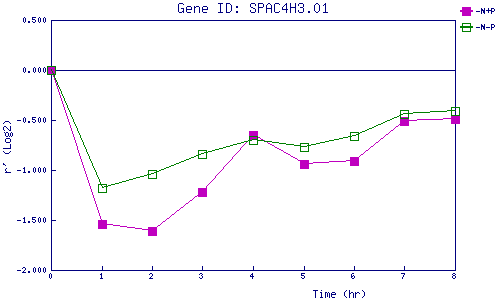
| 0 | 1 | 2 | 3 | 4 | 5 | 6 | 7 | 8 | |
| -N+P | 0.000 | -1.537 | -1.607 | -1.221 | -0.654 | -0.938 | -0.908 | -0.512 | -0.486 |
| -N-P | 0.000 | -1.182 | -1.037 | -0.845 | -0.698 | -0.769 | -0.662 | -0.440 | -0.414 |
|
-N+P: Nitrogen starved in the presence of P-factor -N-P: Nitrogen starved in the absence of P-factor |